1. Project Overview
MeriCast Retail Group is a global consumer goods company operating across North America, Europe, and Asia, serving customers from government and large enterprises to small businesses. Rapid expansion over the past seven years led to fragmented reporting and inconsistent data practices, limiting visibility into sales performance. This project focused on cleaning and analyzing sales data using Microsoft Excel to produce reliable insights that support better decision-making, forecasting, and operational efficiency.
Role: Data / Sales Analyst

2. Business Problem
MeriCast accumulated large volumes of sales data across regions, segments, and time periods, but the data was:
- Inconsistently structured across countries and business units.
- Poorly maintained, with duplicates and missing values.
- Difficult to analyze due to fragmented reporting formats.
As a result, leadership lacked:
- Clear visibility into regional and salesperson performance.
- Reliable revenue and profit reporting.
- Confidence in forecasting and strategic decision-making.
3. Business Objectives
- Standardize and clean global sales data to improve reliability and consistency.
- Create a single source of truth for revenue, profit, and discount performance.
- Identify high-performing regions, products, and customer segments.
- Evaluate salesperson and regional contribution to overall performance.
- Enable leadership to make data-backed strategic and operational decisions.
4. My Approach
Data Cleaning & Preparation
Exploratory Analysis & Pivoting
Dashboard Development
Insight Generation
Tools: Microsoft Excel
5. Key Deliverables
Interactive Excel dashboard and strategic insight summary to support leadership decision-making
6. Insights:
A. The business is selling a lot, but profitability is being dragged down by specific pockets:
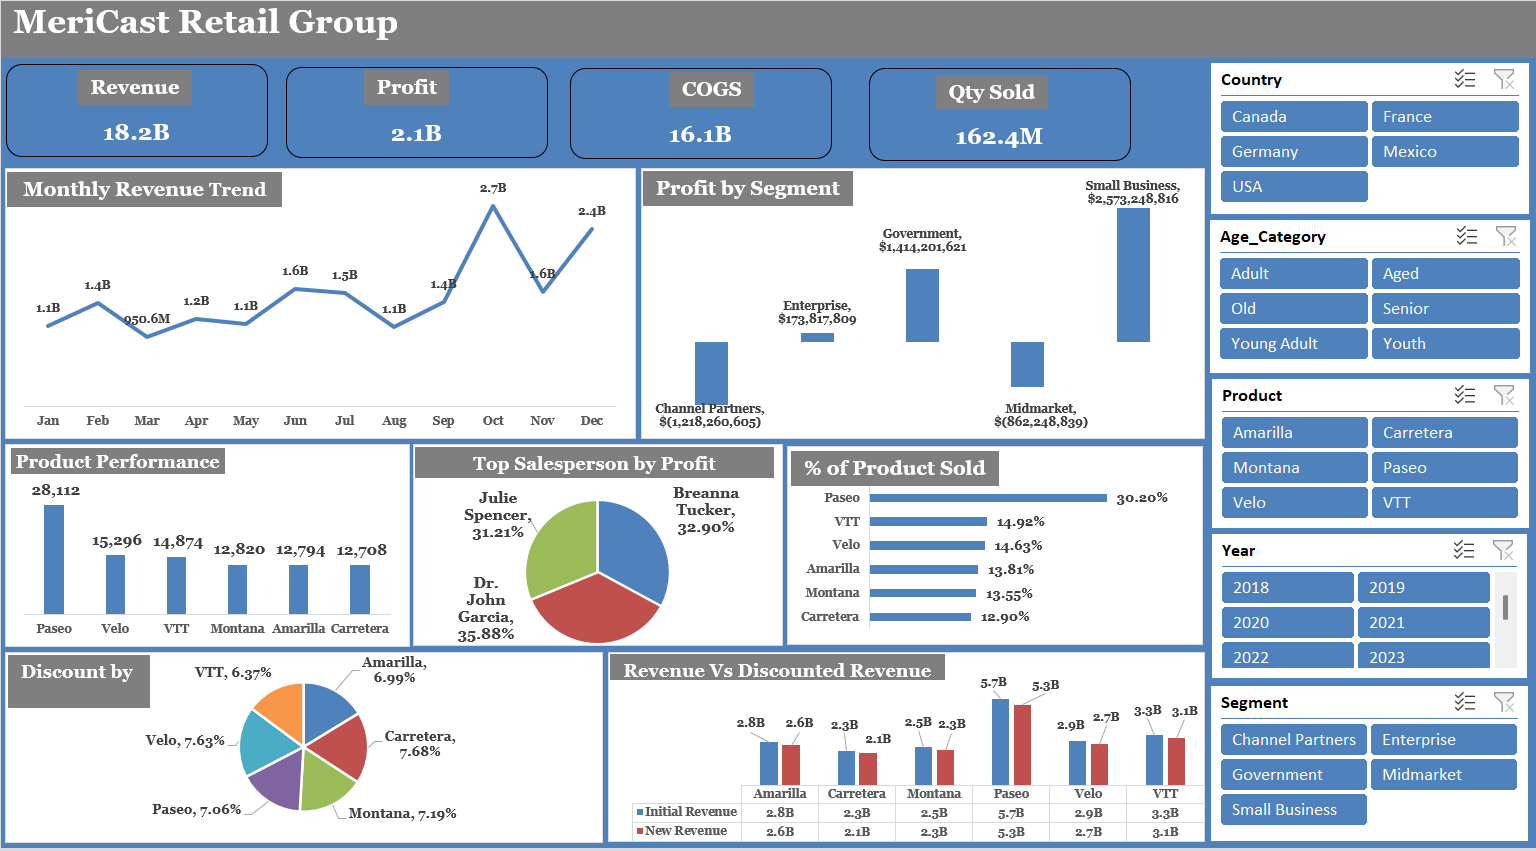
Total Revenue: $19.55B, Discounted Revenue (Net Sales): $18.16B, COGS: $16.08B, Profit: $2.08B
This looks strong at the top line, but the profit is not evenly distributed. It’s being materially distorted by loss-making segments and products.
B. Two customer segments are outright loss-making:
When I broke profit down by Segment, two segments are deeply negative overall, Channel Partners: -$1.22B, Midmarket: -$0.86B.
Meanwhile, Small Business: $2.57B profit, Government: $1.41B profit, Enterprise: $0.17B profit.
C. High discounting is not helping growth, it is actively destroying margin:
High discounts are likely being used as a default lever across some segments/regions, but the data shows it’s not being applied in a controlled, value-generating way.
D. Revenue trend is seasonal but profit trend is not consistently seasonal (June is a red flag):
October ($2.73B), December ($2.41B) are the peaks, but profitability is not consistently aligned with those peaks.
June shows negative profit overall, despite strong revenue volume. it usually points to one of these patterns:
June has a higher concentration of high-discount deals or cost/pricing issues in certain markets during that period.
7. Recommendations:
A. Fix the two loss-making segments first (Channel Partners & Midmarket):
Audit pricing and discount approvals in Channel Partners and Midmarket. Identify whether losses are driven by high discount band exposure, or country-specific execution.
B. Put governance around discounting (especially High discount band):
Require approval above a threshold (e.g., beyond “Medium” band levels) and track discount effectiveness (profit impact per discount point).
C. Investigate the June loss anomaly as a root-cause case study:
What discount bands were most used in June? Which countries contributed most to June losses? Which products drive June revenue?
This single month is a high-signal indicator of what goes wrong when volume is pursued without margin control.